2025 Wildfire Season: Record Breaking Human, Economic, and Systemic Impacts
Published Jan 29, 2026
Executive Summary
This year more than 65,000 wildfires burned over 5 million acres – it was the third-warmest year on record globally, creating a thermal baseline that exacerbated extreme weather patterns.
The 2025 wildfire season was not defined by record acreage burned, but by record-breaking human, economic, and systemic impacts and by clear evidence that wildfire risk is no longer seasonally or geographically bounded.
Changing climate and weather patterns have effectively shattered the concept of a defined “fire season” with one of the most destructive and costly events on record occurring in January – the catastrophic LA fires killed over 30 people, destroyed more than 16,000 structures, and generated economic losses over $40 billion. In late spring, intense fire activity in Canada brought “zombie fires" as well as dangerous pyrocumulonimbus driven fires. Megafires again burned across the West, leading to the destruction of the historic Grand Canyon Lodge on the North Rim.
The consequences of these continued and increasing catastrophic losses extended well beyond the fires as costs continued to ripple across public health, insurance, utilities, and housing with lasting systemic implications and now rival or exceed direct suppression and property losses.
- Wildfire smoke has emerged as a major public health threat, with estimates indicating hundreds of additional deaths from the LA fires and concerns over prolonged hazardous air quality due to the summer’s Canadian fires.
- Utilities increasingly passed wildfire mitigation and liability costs to ratepayers.
- Insurers continued to withdraw from high-risk markets, pushing more households into last-resort coverage and raising concerns about housing stability and mortgage default in fire-prone regions.
Taken together, the 2025 wildfire season underscored a central reality: wildfires are a persistent, systemic risk – one that demands sustained investment in land resilience, community preparedness, and long-term ecological management. Our detailed recap of the 2025 wildfire season highlights key incidents, critical trends, and the urgent need for transformative solutions to combat the intensifying wildfire crisis.
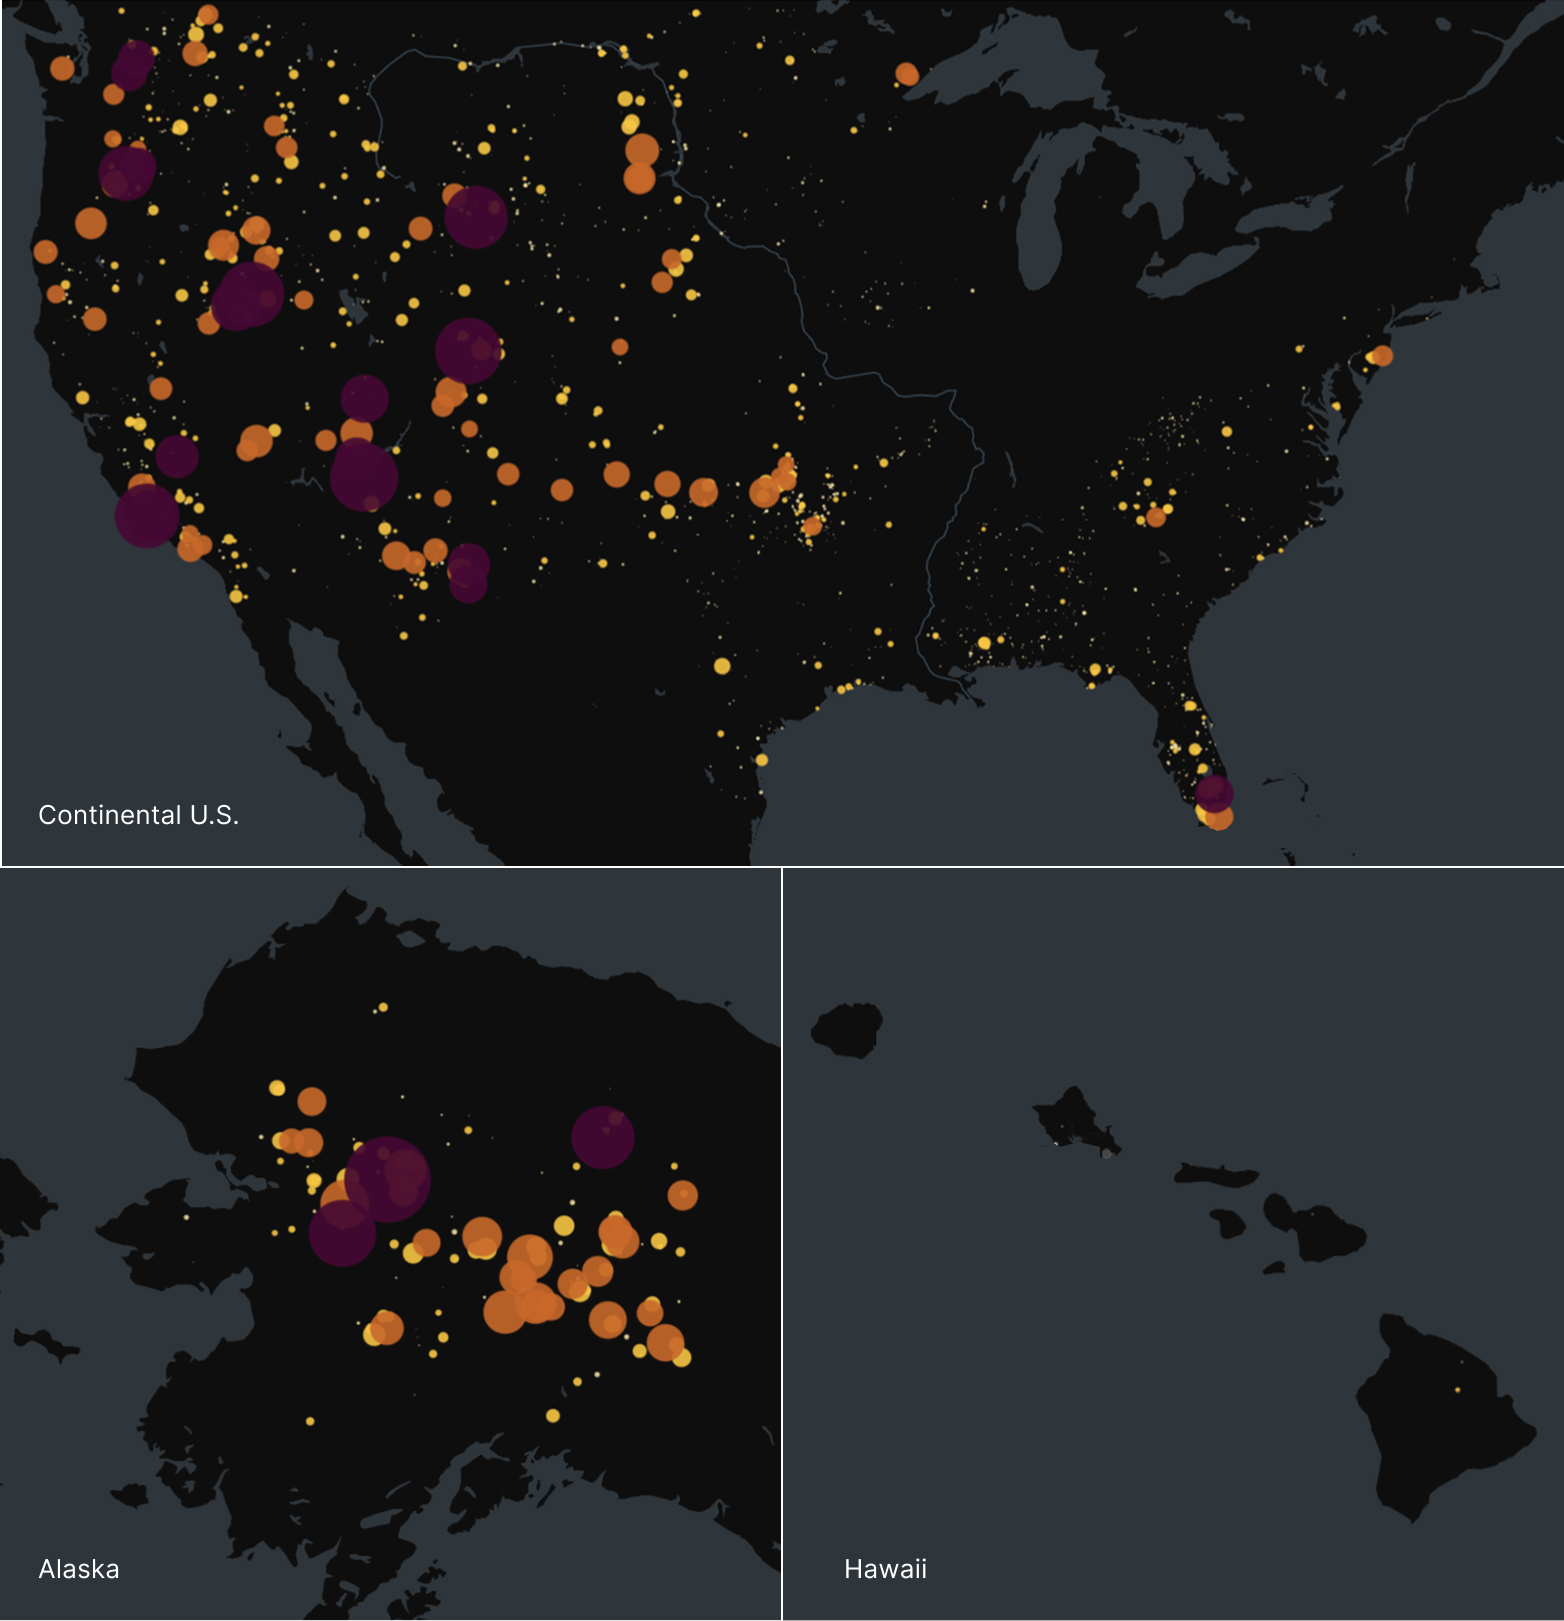
Figure. 2,151 large fires (>100 acres) were responsible for over 96% of the more than 5M acres burned in 2025.
KEY TAKEAWAYS
- The 2025 wildfire season erased the idea of a defined fire season.
January fires in Los Angeles killed 30+ people, destroyed 16,000+ structures, and generated $40B+ in losses.
- Wildfire smoke was acknowledged as a persistent public-health threat.
Smoke exposure was linked to ~400 excess deaths in Los Angeles and drove repeated air-quality emergencies across the Upper Midwest during Canadian fires.
- Megafires and “zombie fires" co-defined the year.
While large Western fires dominated summer acreage, “zombie fires" re-emerged in Canada, with 49 active holdover fires near Fort Nelson in June – eliminating the winter recovery period.
- Wildfire costs increasingly shifted to consumers.
California utilities passed $27B+ in wildfire mitigation costs into electricity rates, while insurers continued retreating from high-risk markets, expanding reliance on last-resort coverage.
- Policy is pivoting toward prevention and hardening—but unevenly.
States accelerated home-hardening rules such as California’s “Zone 0" ember-resistant standard, while prescribed fire remains heavily concentrated in the Southeast, not the West.
Recapping the year in fires
JANUARY:
Catastrophic LA fires
The 2025 wildfire year began with the devastating fires in Southern California, including the Palisades, Eaton, and Hurst fires, which burned roughly 57,000 acres across more than 25 incidents, killing at least 31 people and destroying over 16,000 structures. The speed of these fires overwhelmed traditional evacuation protocols – the Eaton Fire grew to 1,000 acres within six hours. Fires ignited between January 7 and 31 under a prolonged period of severe drought, critically low humidity, anomalously warm winter temperatures, and hurricane-force Santa Ana winds. Investigators later identified suspected arson as the ignition source for the Palisades Fire, while the Eaton Fire was linked to faulty electrical infrastructure, underscoring the role of human-caused ignitions in extreme fire outcomes.
The primary weather driver was a phenomenon meteorologists term “hydro-climate whiplash.” Above-average precipitation during the 2023–2024 water year fueled widespread growth of fine vegetation. Typically, early winter precipitation dampens this fuel load. However, that growth was followed by an abrupt transition to an exceptionally dry late fall and early winter, allowing fuels to cure rapidly, creating a continuous and highly combustible landscape. When the Santa Ana winds arrived in January, the landscape was primed for explosive growth.
MARCH
Siege in Oklahoma
In mid-March, a burst of fires swept across Oklahoma, igniting more than 130 simultaneous fires statewide and marking one of the state’s most destructive early-season fire events. Over 20 major wildfires burned more than 200,000 acres, killing four people, injuring roughly 200, and destroying over 500 structures. The largest fires included the 33 Road Fire (31,245 acres) and the 840 Road Fire (27,866 acres). The Stillwater Fire (~7,600 acres) destroyed more than 200 homes, underscoring the extreme vulnerability of peri-urban areas to fast-moving grass fires.
Fire behavior was driven by hurricane-force wind gusts (55–75+ mph), critically low humidity, and dry vegetation – more than 100 consecutive days without measurable rainfall. These conditions allowed fires to spread rapidly, often outrunning suppression efforts. The March outbreak reinforced the growing fire risk outside the traditional summer wildfire season.
MAY & JUNE
Zombie fires in Canada and Alaska ignitions
By late spring and early summer, wildfire activity intensified sharply across Canada, with more than 90 fires burning out of control, at least two deaths, and over 33,000 residents displaced across Alberta, Saskatchewan, Manitoba, and British Columbia. Alberta saw more than 89,000 acres burn, with some fires generating dangerous weather-generating pyrocumulonimbus clouds. Manitoba recorded roughly 490,000 acres burned and more than 17,000 evacuations, while Saskatchewan reported over 4,000 people forced from their homes. In British Columbia, large lightning-caused fires burned more than 600,000 acres.
Over the full season, Canada recorded 6,125 wildfires burning 21.8 million acres, more than double the 10-year average. Smoke repeatedly crossed into the United States, degrading air quality across the Upper Midwest and producing some of the worst global air quality readings for several days.
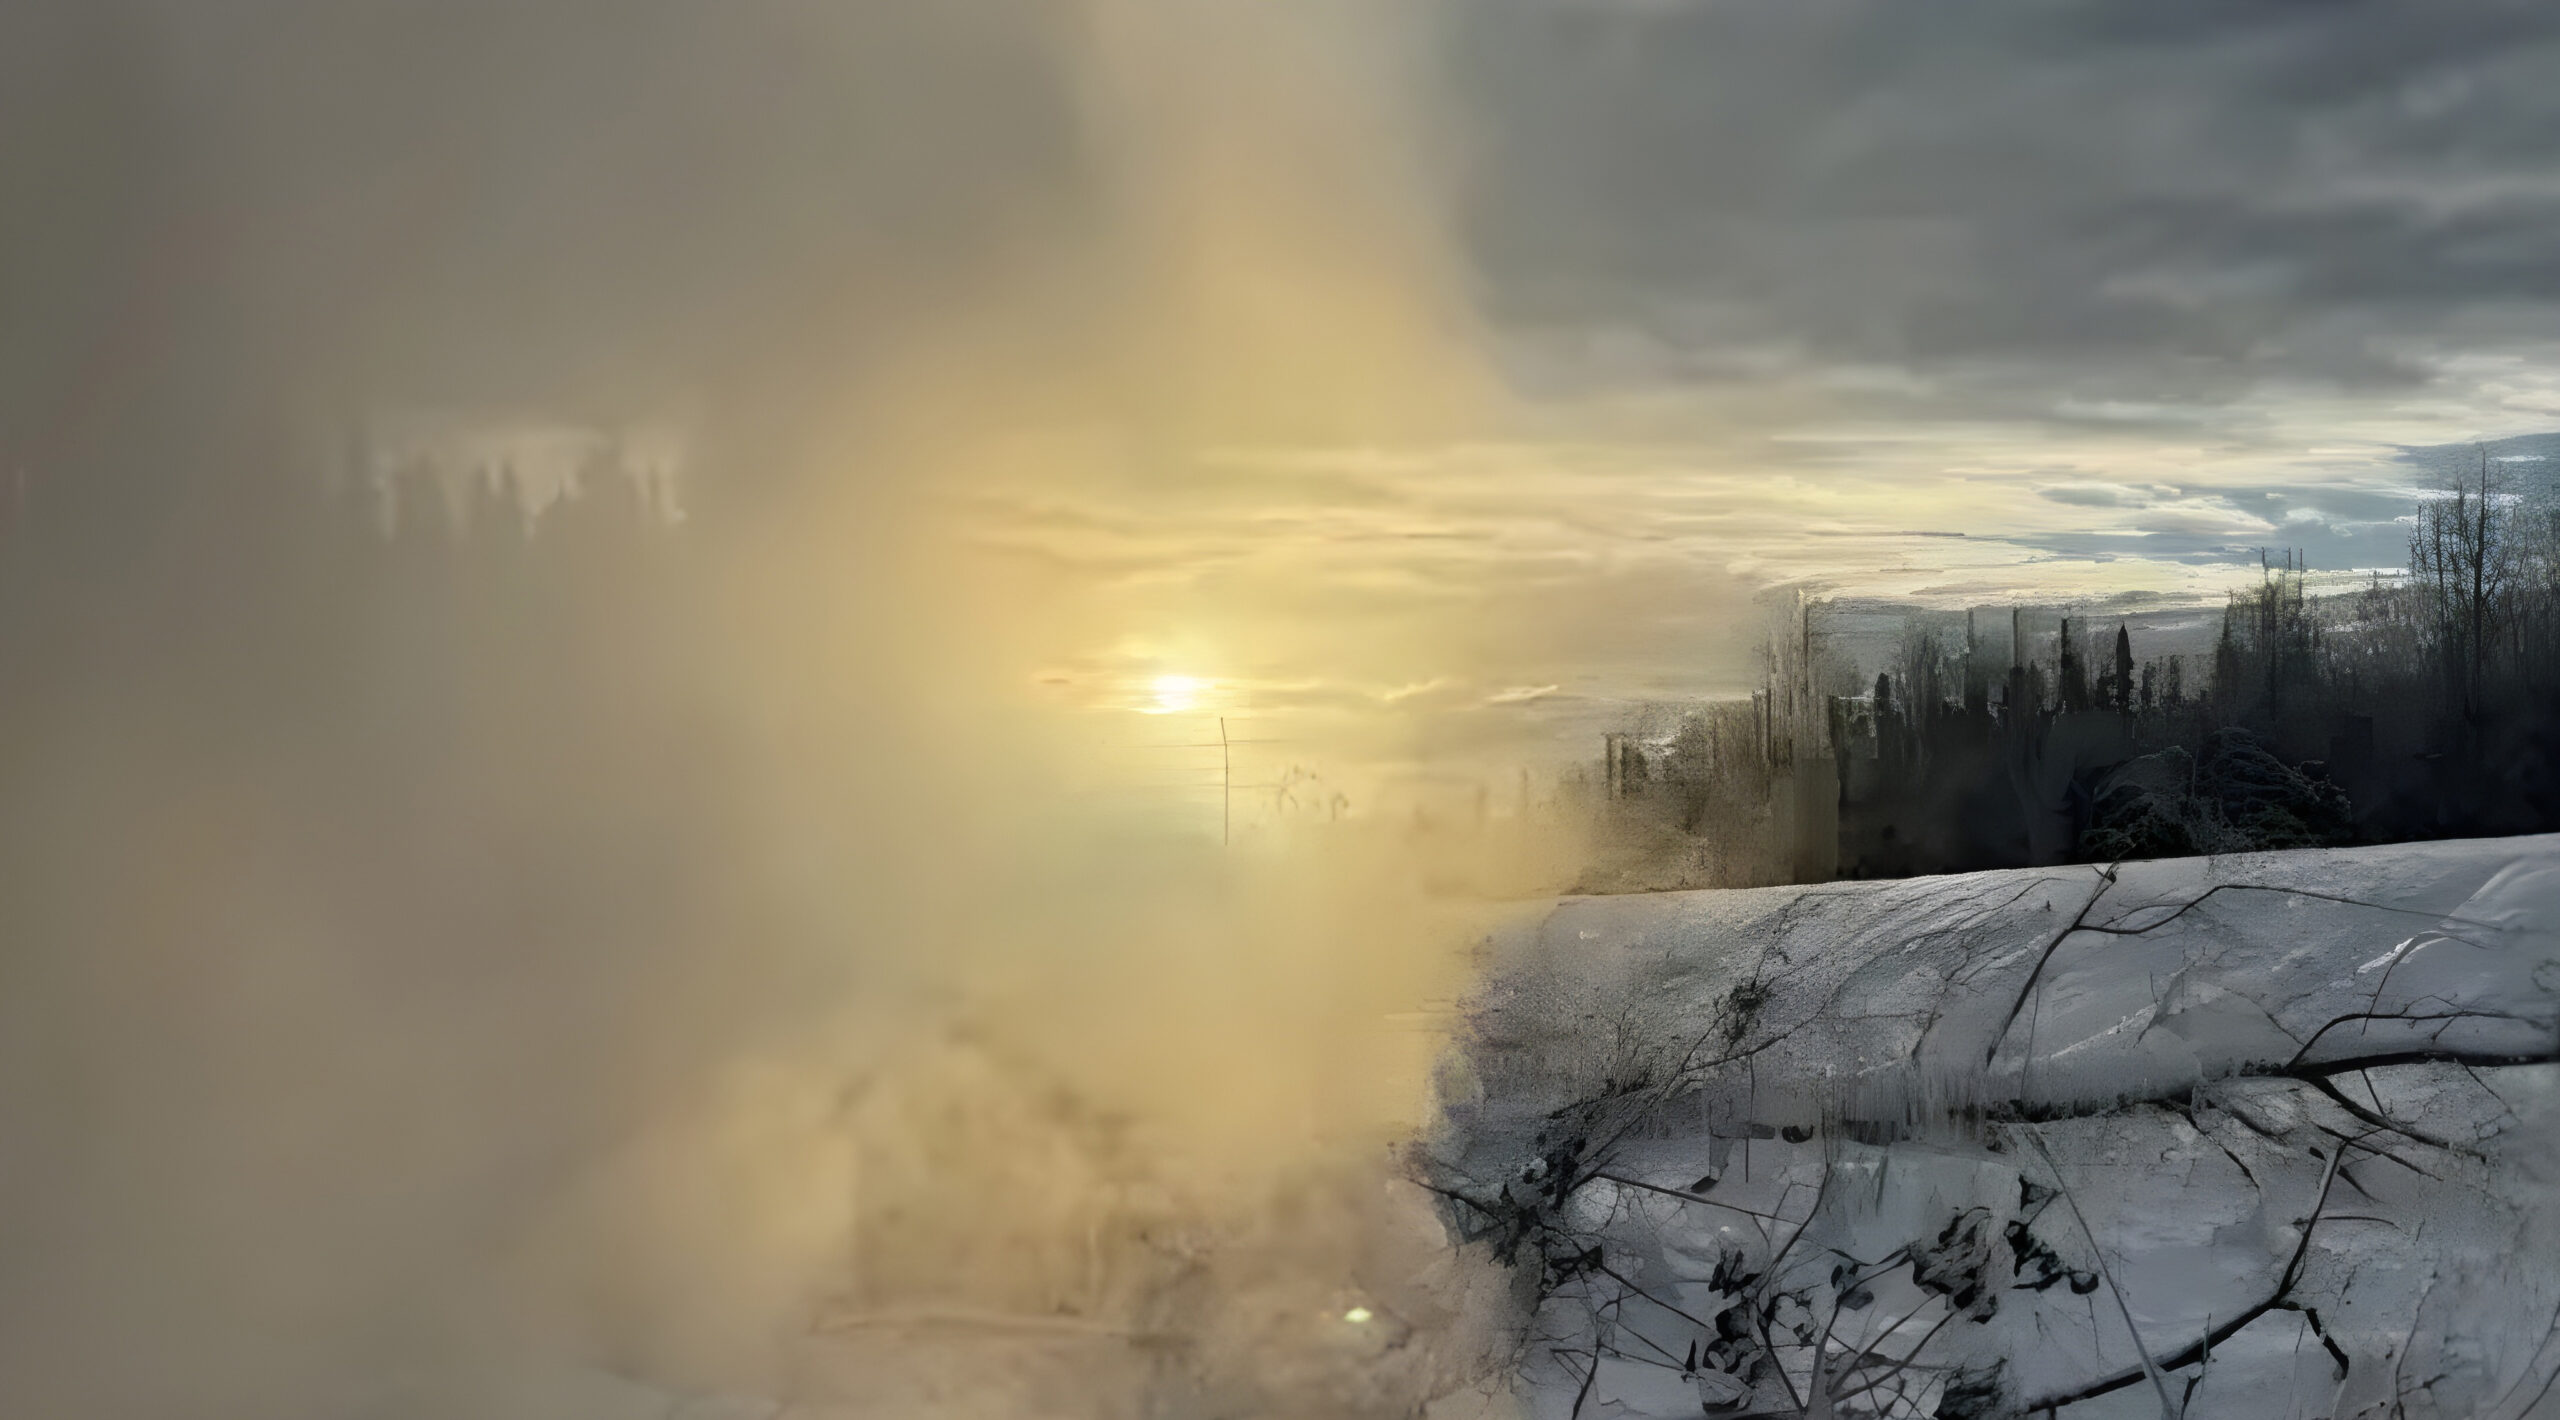
A zombie wildfire burning near Ft. Nelson in British Columbia, Canada. Photo by BBC World News.
A defining feature of 2025 was the return of “zombie fires”, fires that never completely went out and re-emerged. After six to seven years of cumulative drought, fires from the 2024 season did not extinguish with the winter snows. Instead, they smoldered in the dehydrated organic peat layers (duff) beneath the snowpack. As spring arrived and the snow melted, these fires re-emerged, breaching the surface and igniting the forest floor. In early June, the BC Wildfire Service tracked 49 active so-called “zombie fires", effectively eliminating the traditional winter recovery period and forcing immediate suppression at snowmelt.
Alaska also experienced an active June, with 1.68 million acres burned—double the 10-year average—driven primarily by lightning ignitions in interior and tundra regions. Major incidents included the Klikhtentotzna Fire (117,908 acres) and the Moldy Fire (72,431 acres) fires. While distinct from Canada’s zombie fires, Alaska’s tundra burning raised separate concerns, as these ecosystems release large stores of carbon and accelerate permafrost thaw.
Fire perimeter progression for the Klikhtentotzna fire in Alaska, lasting from, June 17 to August 10. Source: Cornea
JULY & AUGUST:
Devastation at the Grand Canyon and Megafires across the West
By mid-summer, wildfire activity across the Western US intensified under persistent heat, delayed monsoons, and prolonged drought, particularly in the Southwest. The defining incident of the season was the Dragon Bravo Fire on the Grand Canyon’s North Rim, a fire that reshaped both the landscape and the public conversation around fire management.
Ignited by lightning on July 4, the fire initially burned under conditions that supported a “confine and contain" strategy. That calculus changed abruptly on July 11, when humidity plummeted and winds shifted, allowing the fire to escape containment and expand rapidly. It ultimately burned approximately 145,500 acres, sweeping through the developed North Rim area and destroying the historic Grand Canyon Lodge, the visitor center, employee housing, and critical infrastructure including water treatment facilities. Suppression costs reached $135 million. The incident also triggered political scrutiny and an investigation called for by the Arizona governor.
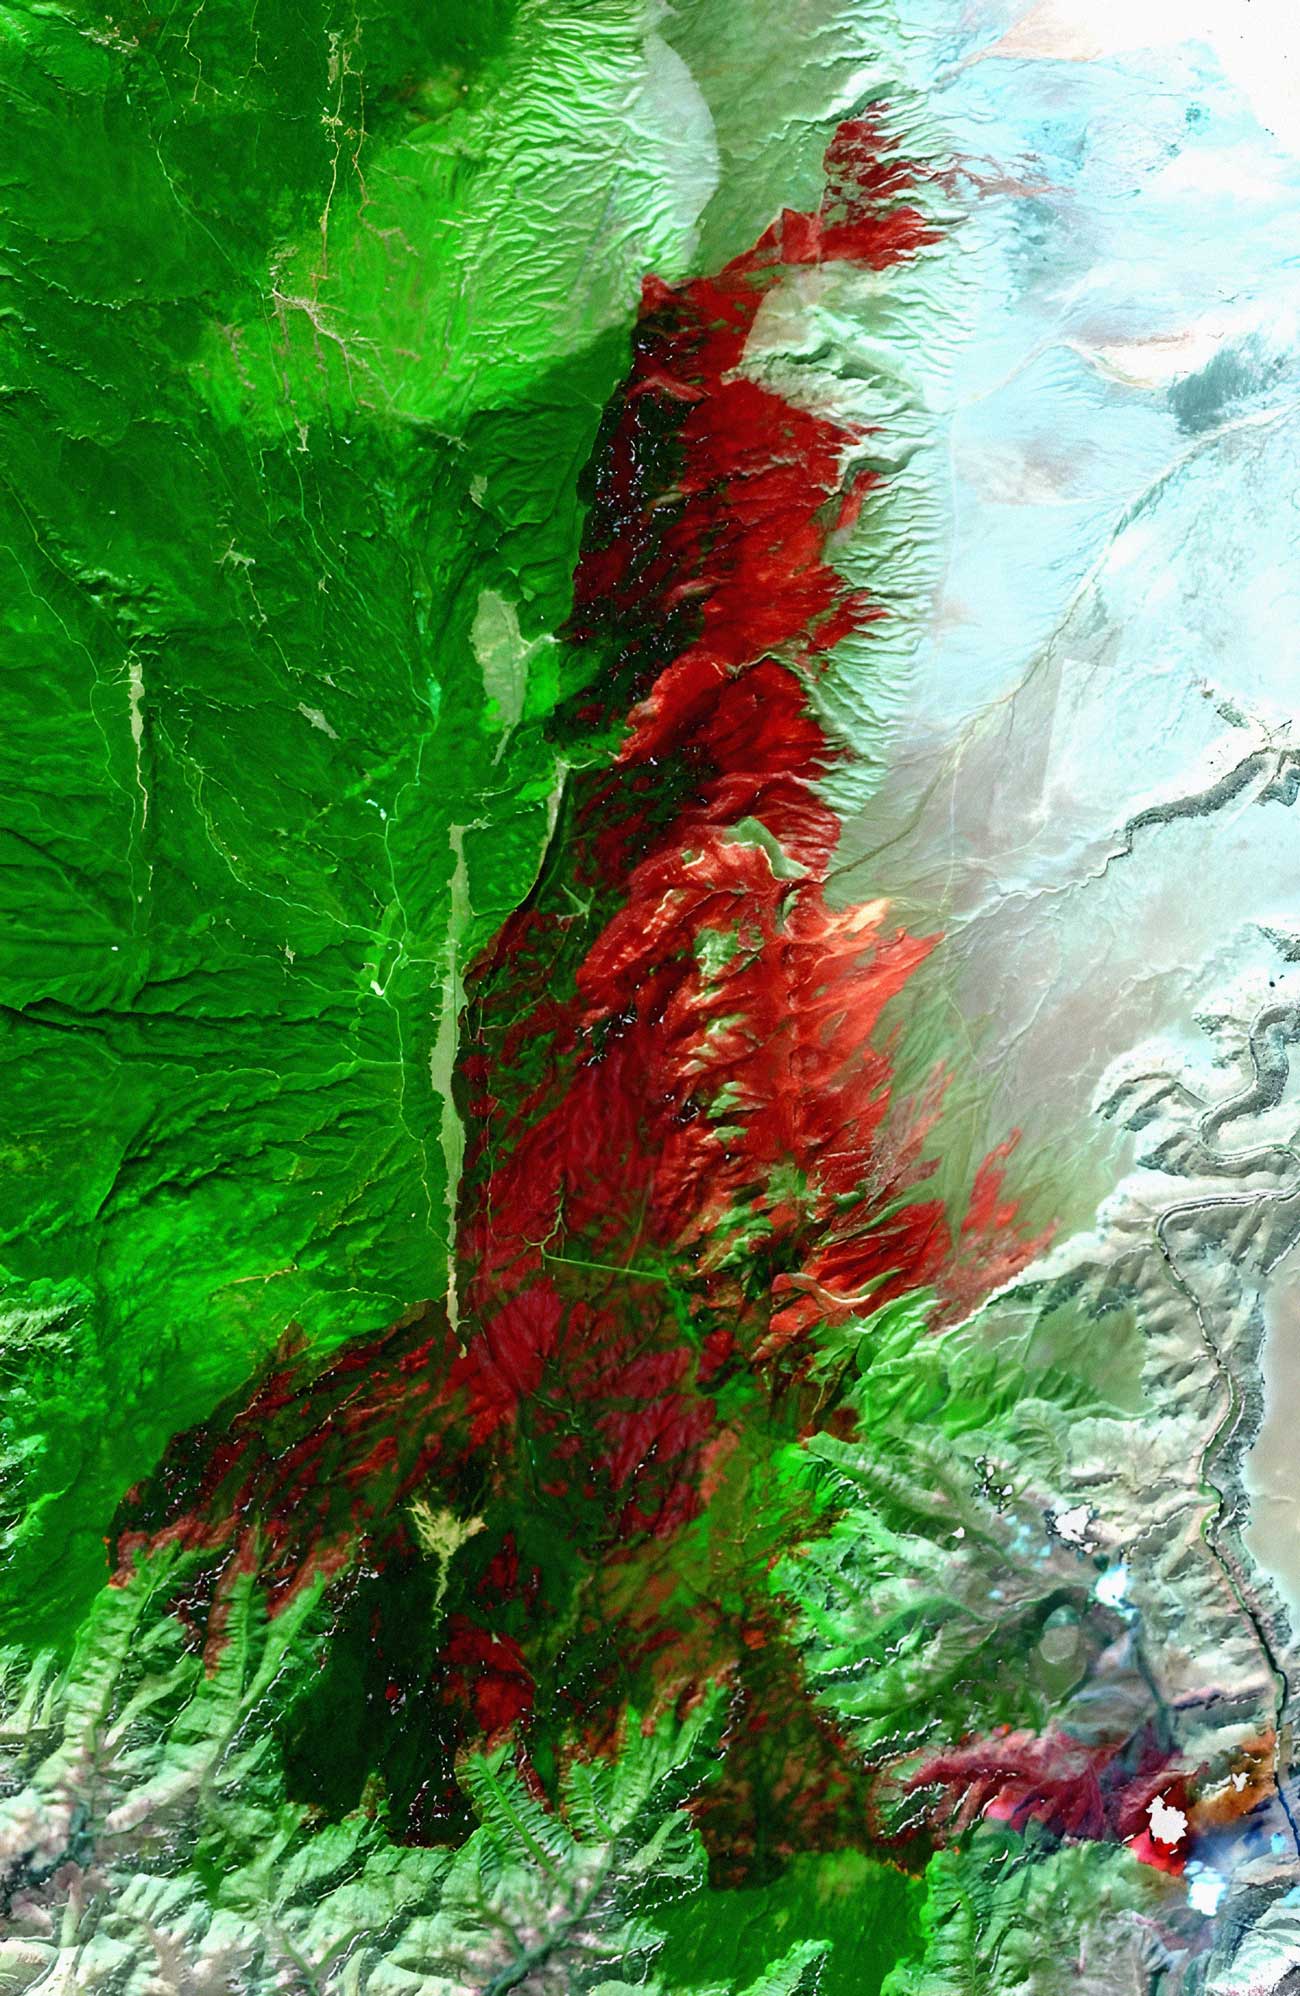
A false color composite of the Dragon Bravo Fire showing burn scars in red. Image by Inciweb,
Elsewhere in the Southwest, Arizona and New Mexico saw a heavy concentration of large fires. In Arizona, the White Sage Fire burned nearly 59,000 acres, while the Oak Ridge Fire forced evacuations near Window Rock on the Navajo Nation. New Mexico experienced multiple major incidents, including the Buck, Trout, and Turkey Feather fires, with total regional suppression costs nearing $100 million.
In California, the Gifford Fire became the state’s largest fire of 2025, burning more than 131,000 acres and costing over $200 million in suppression. In Wyoming, the Red Canyon Fire burned more than 124,000 acres, its spread amplified by cheatgrass, highlighting how climate-based ecological change is reshaping fire behavior.
Taken together, July and August illustrated the compounding risks facing western landscapes: extreme weather, altered fuel conditions, and difficult tradeoffs in fire management with a large wildland urban interface from iconic national parks to working rangelands and urban edges.
2,151 large fires (exceeding 100 acres) were responsible for over 96% of acres burned. Among these, 21 megafires (fires over 40,000 acres) burned 32% of the total acreage. Below is the full list of megafires.
MEGAFIRES IN 2025
| Wildfire Name | Size (in Acres) | Est. Cost | Structures Destroyed | Cause | State | Start Month | Days Burned |
|---|---|---|---|---|---|---|---|
| LA Fires (Palisades, Eaton, Hurst) | 38,268 | Not reported (>$40B in losses) | 16,255 | Arson, Faulty power lines | CA | January | 41 |
| BUCK | 57,604 | $10.6M | Lightning | NM | June | 64 | |
| Trout | 47,294 | $45.2M | 2 | Lightning | NM | June | 104 |
| Klikhtentotzna | 117,908 | Not reported |
Lightning | AK | June | 107 | |
| Christian | 64,065 | Not reported | Lightning | AK | June | 93 | |
| Moldy | 72,217 | Not reported | Lightning | AK | June | 102 | |
| Madre | 80,786 | $31.7M | Under investigation | CA | July | 26 | |
| Dragon Bravo | 145,504 | $135M | 113 | Lightning | AZ | July | |
| White Sage | 58,985 | $20.7M | 0 | Lightning | AZ | July | 165 |
| Monroe Canyon | 73,721 | $103M | 10 | Under investigation | UT | July | 105 |
| CRAM | 95,692 | $12.9M | 18 | Power generation / transmission | OR | July | 158 |
| Gifford | 131,612 | $202.5M | 5 | Under investigation | CA | August | |
| Jakes | 82,217 | $12.7M | 3 | Lightning | NV | August | 95 |
| Lee | 137,758 | $4.8M | 5 | Lightning | CO | August | |
| RED CANYON | 124,709 | Not reported | 0 | Lightning | WY | August | 47 |
| Cottonwood Peak | 132,603 | Not reported | Lightning | NV | August | 81 | |
| MILE MARKER 39 FIRE (06) | 48,000 | Not reported | 2 | Roadside Ignition | FL | August | |
| GARNET | 59,844 | $18.4M | 3 | Lightning | CA | August | 99 |
| LABOR MOUNTAIN | 42,962 | $29.6M | 6 | Lightning | WA | September | 107 |
| LOWER SUGARLOAF | 42,958 | Not reported | 0 | Lightning | WA | September | 105 |
| BLACK ROCK | 43,965 | $22.1M | 4 | Lightning | OR | September |
Source: NIFC
Growing human and economic tolls
The costs of worsening smoke and air quality
Beyond the fires themselves, smoke emerged as a pervasive and critical public-health concern. After the Los Angeles fires, a widely cited JAMA study using excess-mortality modeling estimated the true toll at approximately 440 deaths (against the 31 directly attributed deaths), driven by cardiovascular and respiratory complications, displacement stress, and disruptions to medical care.
Canada’s intense summer fire activity also degraded air quality, establishing a persistent “smoke corridor" in North America. In May and June, Minneapolis and Chicago recorded some of the worst AQI readings globally, and Minnesota issued record air-quality alerts lasting seven consecutive days.
The scale and persistence of smoke exposure in 2025 underscored a critical shift in wildfire risk estimation: smoke routinely traveled hundreds to thousands of miles beyond fire perimeters, straining health systems, disrupting work and schooling, and reframing wildfire smoke as a cross-border public-health and policy challenge, not a localized hazard.
Utilities and Insurance Fallout
Wildfire costs in 2025 extended far beyond suppression and property loss, increasingly showing up in utility rates, insurance availability, and housing markets, with impacts spreading across consumers markets.
Facing billions in liabilities and the rising cost of wildfire-mitigation programs (vegetation management, grid hardening, inspections, etc.), utilities and regulators have increasingly allowed these expenses to be recovered through rates. In California, regulators authorized the state’s three largest investor-owned utilities (PG&E, SCE, SDG&E) to pass roughly $27 billion in wildfire-related prevention and mitigation costs to customers, contributing meaningfully to higher retail bills. Similar actions elsewhere signal that wildfire risk is now treated as a persistent operating cost of modern power systems, not a one-off emergency, including rate hikes of up to 18%, “Fixed Recovery Charges," and PG&E’s use of Non-Bypassable Charges to fund mandatory contributions to the statewide Wildfire Fund.
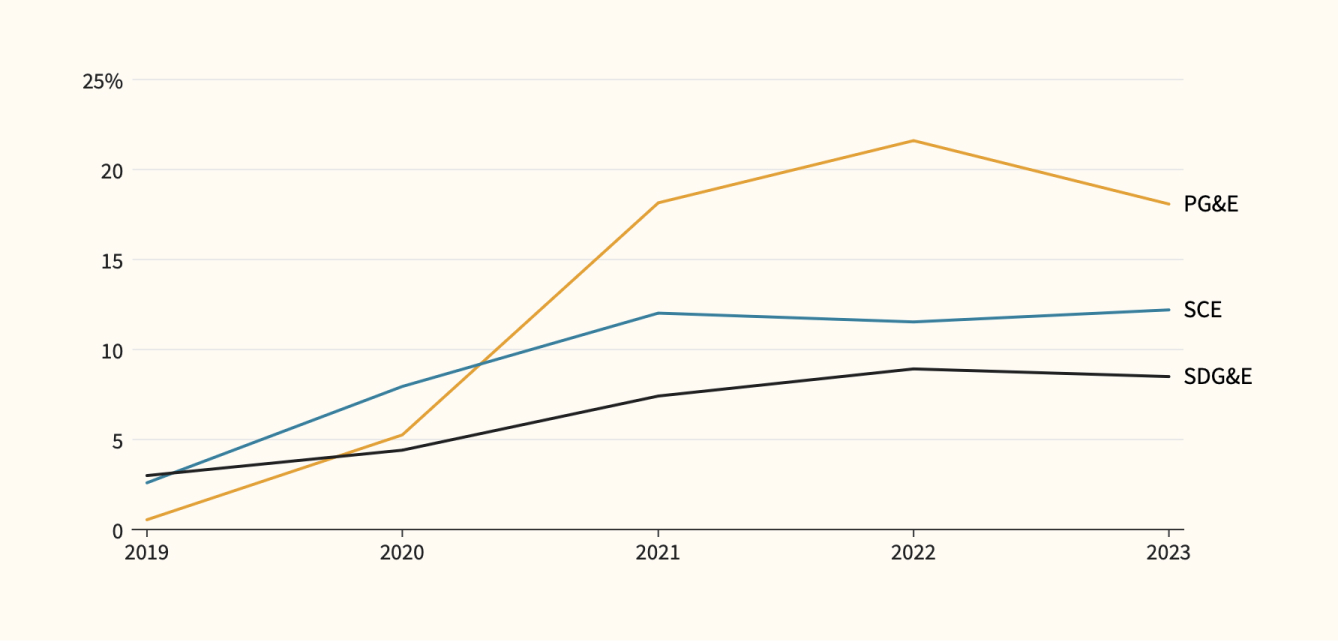
Relative increases in California electricity rates per utility. Graph and research by CalMatters.
The private insurance industry has likewise signaled that much of the wildland–urban interface is uninsurable at current price points. The LA fires were the costliest insured wildfire event on record, thus accelerating an ongoing retreat, with seven of the top twelve insurers in CA having either paused or placed severe limitations on new business. More households were pushed onto the California FAIR Plan (the state’s insurer of last resort), while rising premiums and force-placed insurance increased mortgage delinquency risks in fire-prone regions—a trend spreading across the American West.
In response, 2025 also saw accelerating movement toward mandatory, standardized home and structure hardening. In California, Governor Newsom’s Executive Order N-18-25 and other proposed legislations pushed agencies to finalize enforceable rules for an ember-resistant “Zone 0" (the first five feet around a structure), explicitly signaling a shift toward regulation of the built environment in wildfire-prone areas.
Beyond housing and utilities, wildfire impacts reached agriculture. Smoke exposure created livestock health issues and burnt rangelands forced ranchers to liquidate herds early. Farmers lost more than $11 billion in wildfires, with over $9 billion uninsured – underscoring the widening economic footprint of fire.
Conclusions and a focus on land management
While the overall acreage burned in 2025 was lower than in the recent past, it was a record year in cost implications – evidence of an intensifying wildfire climate.. Adaptive and mitigating strategies that serve to safeguard lives, property, and natural landscapes against an increasingly volatile future are in development, require more widespread adoption, and include: Enhanced fire detection and suppression techniques, Proactive land and ecological management, Building and infrastructure hardening, Community awareness and education, and Climate change mitigation implementation. Read our 2024 report for more details.
Land management in acres from 2015-2025 in FL, GA, CA. Sources: FL State Forestry, GA State Forestry, CA Wildfire & Forest Resilient Task Force.
Returning to a regimen of restorative land management policies is critical, including a reversal of total fire suppression policies, the use of prescribed fire, mechanical thinning, and other fuel management activities. These practices reduce wildfire risk by removing fuels on the ground, enhance forest health by favoring fire-resistant trees and fire-adapted flora and fauna, and mitigate climate change. The Southeast is a leader in this effort, with Florida and Georgia collectively conducting prescribed burns on over 3M acres in 2024 while limiting wildfire losses to just 48K acres.
By contrast, California reported 1M acres of land management activities in 2024 across prescribed burns, mechanical and hand thinning, grazing and harvest. While California faces bigger hurdles in burn execution because of its long history of total fire suppression, more complex terrain, and regulatory and operational requirements, scaling up these practices is vital to building wildfire resilience and protecting communities in the face of a changing climate.
Citations
- Copernicus Atmosphere: 2025 Sees Intense Wildfire Year in Northern Hemisphere
- Copernicus: CAMS Tracks Intense Global Wildfire Activity in First Six Months of 2025
- National Interagency Fire Center: Open Data Portal
- National Interagency Fire Center: Fire Information and Statistics
- European Centre for Medium-Range Weather Forecasts: 2025 Third Warmest Year
- Wikipedia: 2025 Canadian Wildfires
- Wikipedia: January 2025 Southern California Wildfires
- KJZZ: Arizona Journalist Delves into the Decision to Let the Dragon Bravo Fire Burn
- The Guardian: Grand Canyon Dragon Bravo Fire
- Boston University School of Public Health: Death Count for 2025 LA County Wildfires Likely Hundreds Higher Than Official Records
- Center for Disaster Philanthropy: North American Wildfires
- Wikipedia: 2025 United States Wildfires
- ReliefWeb: Climate Change and Devastating Wildfires Exacerbate Losses for Insurers
- ScienceDirect: Research Article on Wildfire Impacts
- The Revolving Door Project: Mapping the Home Insurance Crisis
- CTIF: Satellites and AI Revolutionize Wildfire Detection with FireSat Project
- Guy Carpenter: Wildfires Strategic Climate Solutions Report (March 2025)
- Statistics Canada: Daily Report on Wildfire Data
- BC Wildfire Service: Wildfire Season Summary
- BBC News: US and Canada Wildfire Coverage
- LA Times: Grand Canyon Fire Dragon Bravo Causes North Rim Destruction
- JAMA: Medical Journal Article on Wildfire Health Impacts
- CalMatters: PG&E Utilities Wildfire Prevention Costs Impact Customer Bills
- Pacific Power: 2025 Oregon Rate Proposals
- California Governor’s Office: Executive Order on Urban Conflagration (N-18-25)
- ProPublica: Trump DOGE Cuts to Forest Service Firefighting
- Associated Press: Wildland Firefighting Under Trump Administration
- Congressional Budget Office: Wildfire-Related Publication
- U.S. Congress: House Bill 471 (119th Congress)
- Reuters: Trump Funding Freeze Halts Wildfire Prevention Work
- New York Post: Chicago and Minneapolis Face Worst Air Quality as Canadian Wildfire Smoke Returns
- Deep Sky Climate: Insurers Retreat as 2025 Wildfire Risk Reaches Dangerous Levels
- Colorado Sun: Colorado Home Insurance Nonrenewals Crisis
- Certified Financial Planner Board: Key Statistics and Data
- Program Business: Wildfire Risk 2025 – Priced Out and Burned Out
- Wyoming Public Media: Wyoming Wildfires Burned Almost 250,000 Acres in 2025
- Interagency Tracking System: Wildfire Data Portal